Monitoring Statistics
Monitoring statistics is a simple yet powerful tool that helps you manage your environments effectively. The platform’s built-in statistics module provides information about how much of your billable resources you’re using. This can help you adjust your setup to better fit your needs and save money.
Viewing Statistics
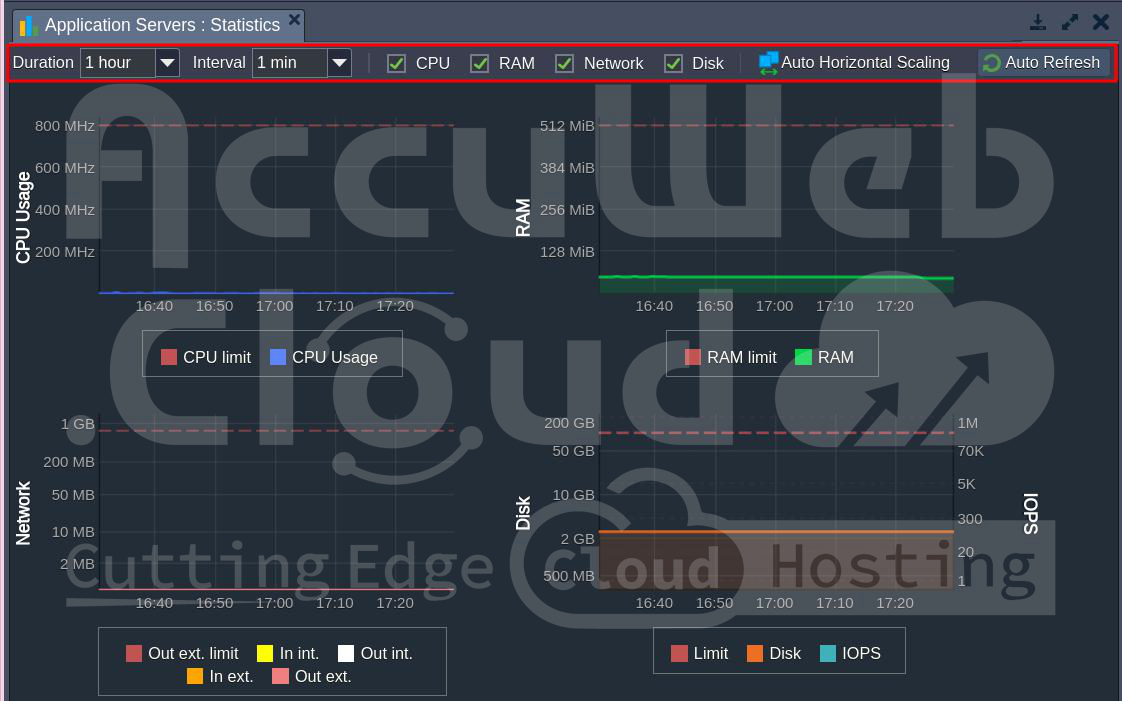
You can see how much resources each part of your environment is using: like application servers, balancers, web servers, and databases. Just click the right button next to the thing you want to check:
When you open it up, you’ll find stats on different stuff:
- RAM: How much memory is being used (in MB)
- CPU: How much the processor is working (in MHz)
- Network: How much data is being sent back and forth (in MB)
- Disk: How much stuff is stored (in MB) and how many times stuff is being moved around (in IOPS)
The limits for RAM and CPU depend on how many cloudlets you have. You can set the disk amount within certain limits, and the limits for network and IOPS are set by your hosting provider. Also, know that the network limit is not about how much you use in total, but how much you use per second (Mbps) externally.
You can dig deeper into the stats by changing how often they’re recorded and for how long, and you can turn different parts on or off.
- Adding up everything for CPU, network, disk IOPS, and disk IO
- Picking the highest number for RAM and disk
With this data, you can keep an eye on how much your app is using (you can see details for different times), and predict your future costs. You can also set up alerts to email you if your usage goes up or down by a certain amount. This can save you a lot of money!
Check out the linked document for more info on how you’re charged for resources.
Next, we’ll talk more about tracking I/O usage.
Monitoring Input/Output Operations (I/O)
Keeping an eye on Input/Output Operations per Second (IOPS) is a common way to measure storage performance. It helps to see how well a container can handle reading and writing data without slowing down.
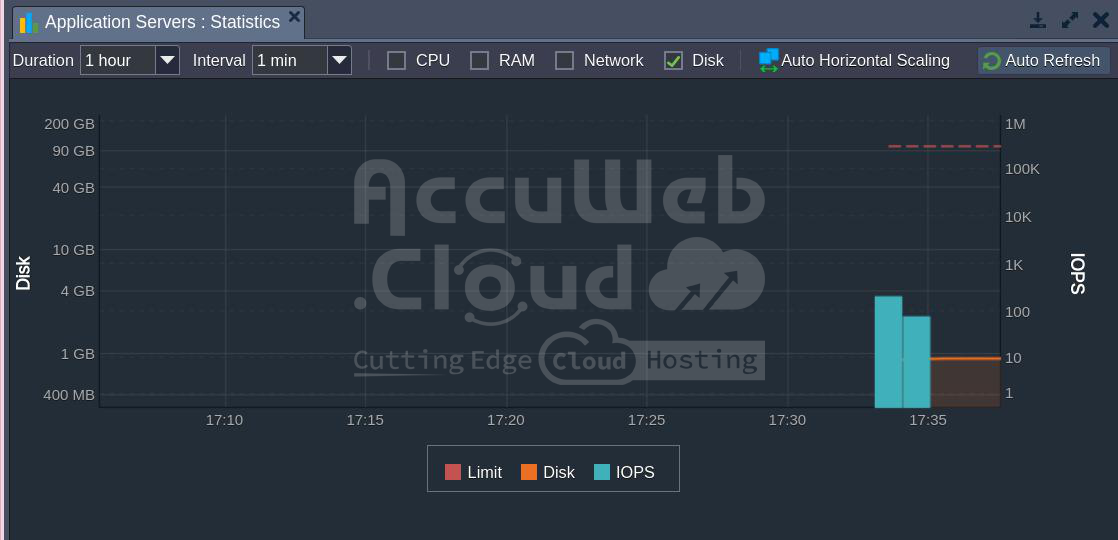
1. IOPS data is shown in the Disk stats section with its graph. We’ve focused on this because it’s what we’re most interested in:
The more operations being handled, the heavier the system load. To avoid performance problems, there’s a limit on how many IOPS are allowed. This limit is shown as a red dotted line on the graph, set by your hosting provider.
If you hit this limit, it means your container’s performance could suffer. You might need more servers or to optimize your app.
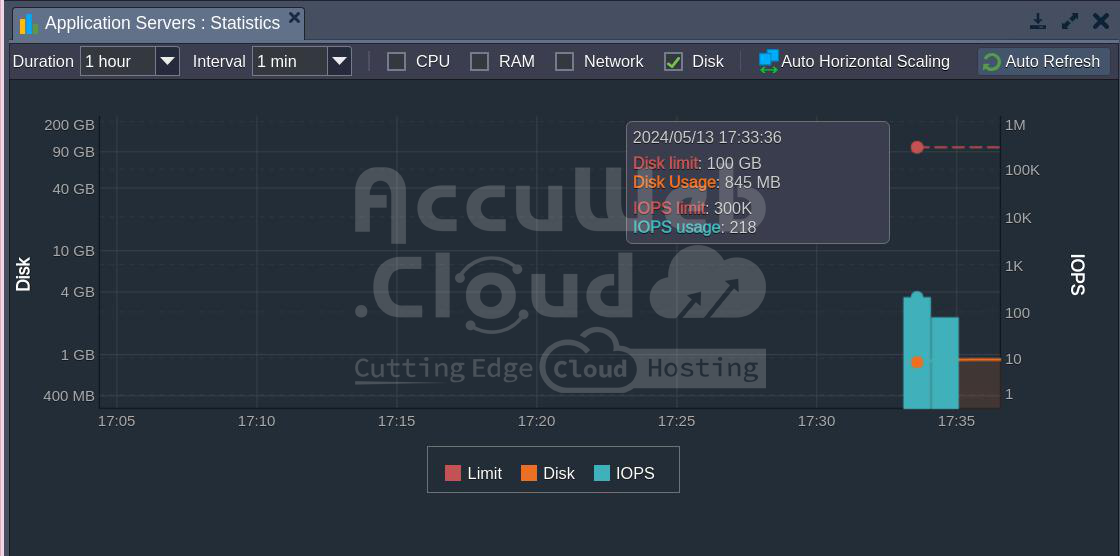
2. If you hover over a point on the Disk/IOPS graph, you’ll see a pop-up with details:
- The date and time the stats were collected
- How much disk space the container is using
- The limit for disk space
- The number of IOPS handled during the interval
- The limit for IOPS
3. The IOPS limit depends on the interval you choose. For example, if you set a 1-hour interval, the limit for 1 minute (which might be 6000 – see the image in the previous step) will be multiplied by 60:
6000 * 60 = 360,000
This gives you real-time info on your disk load so you can keep an eye on it.


