When you set up a system, you decide how much space each part can use. This helps control how resources are used and how much money is spent. If an application needs more resources as it gets busier, and you set the limits too low, the app might not work well.
You can set up automatic alerts to track how much your application is using and when it needs more resources. These alerts will email you if a certain part of the system is using too many or too few resources at a certain time. This way, you’ll know if your application’s load is changing.
How do you create an alert for the application in the AccuWeb.Cloud dashboard?
To set up an alert, follow these steps:
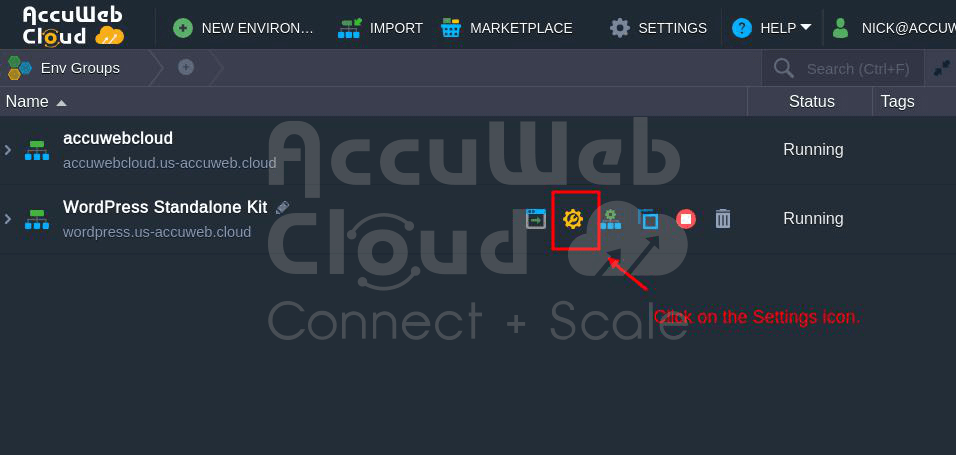
Step 1. Log in to the AccuWeb.Cloud Dashboard and click “Settings” for your desired environment.
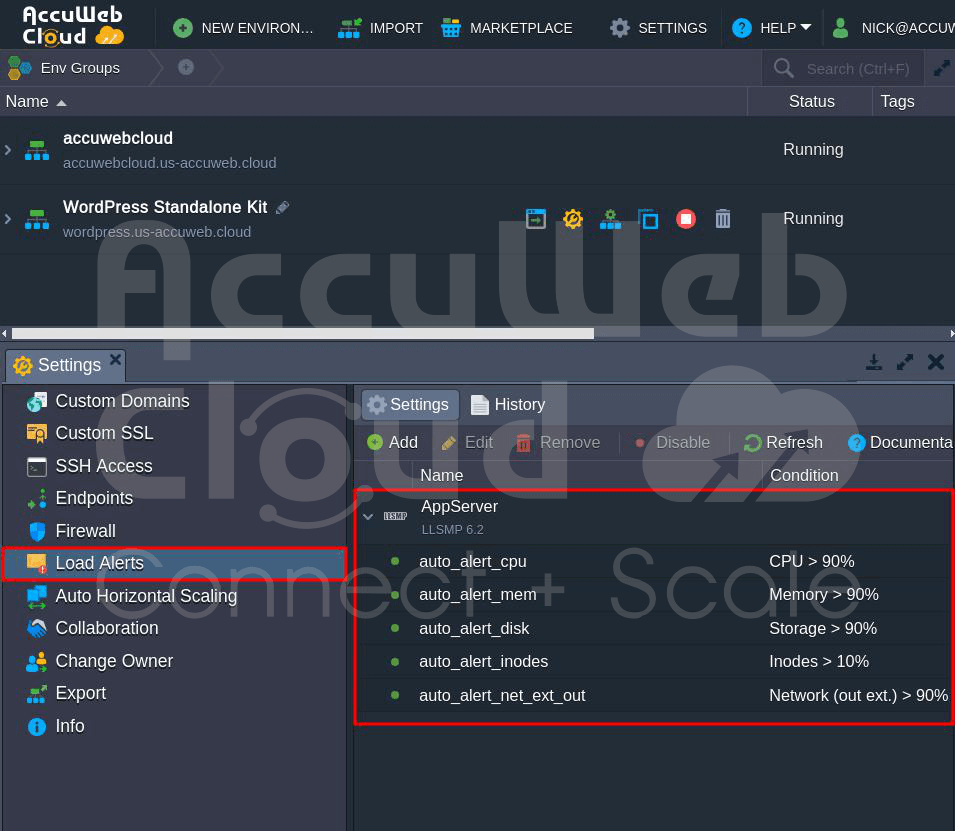
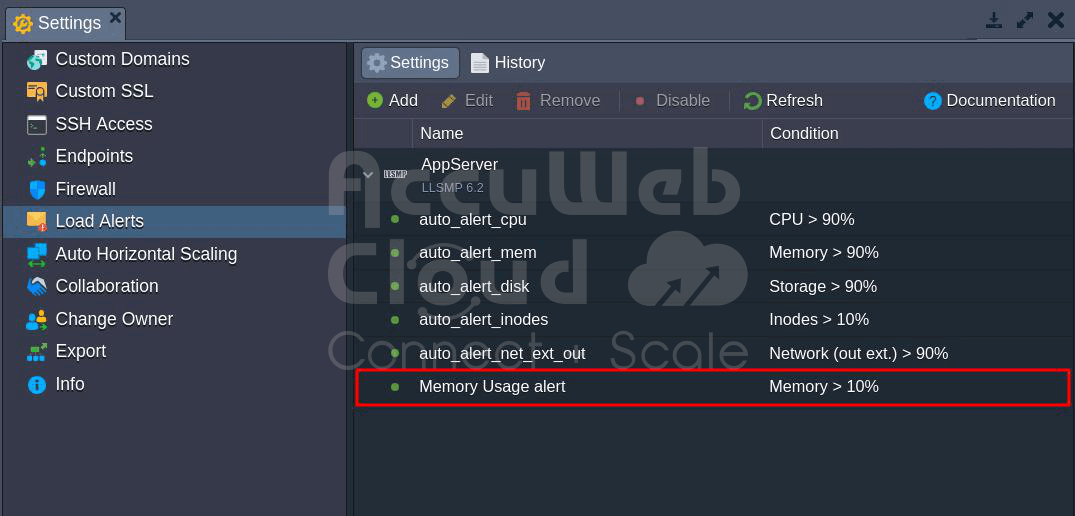
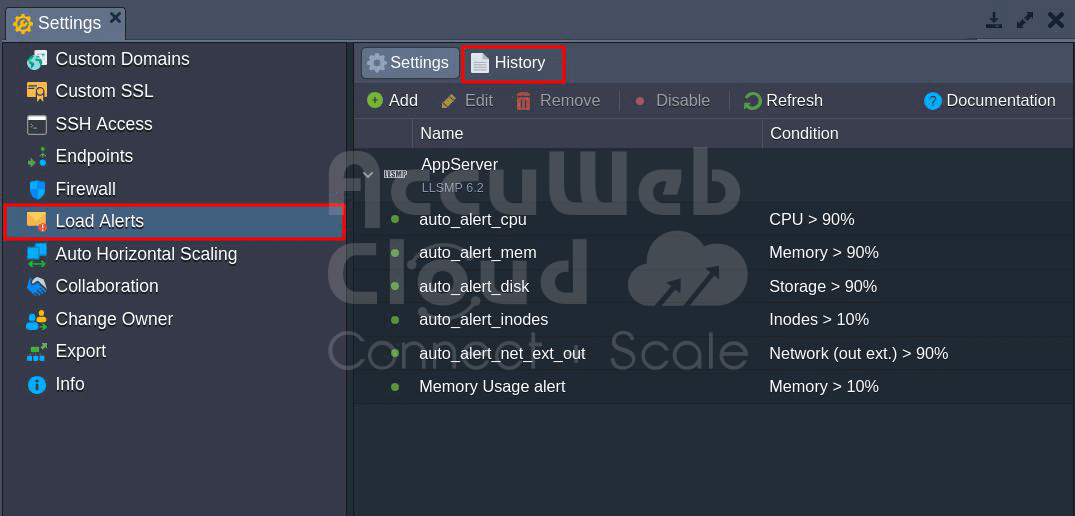
Step 2. Click on the Load Alerts option in the opened tab.
Here, you might see some triggers automatically included when creating your environment. If these triggers are present, they will alert you when your computer’s RAM, CPU, disk space, inodes, or network usage are nearing the limits set by the system.
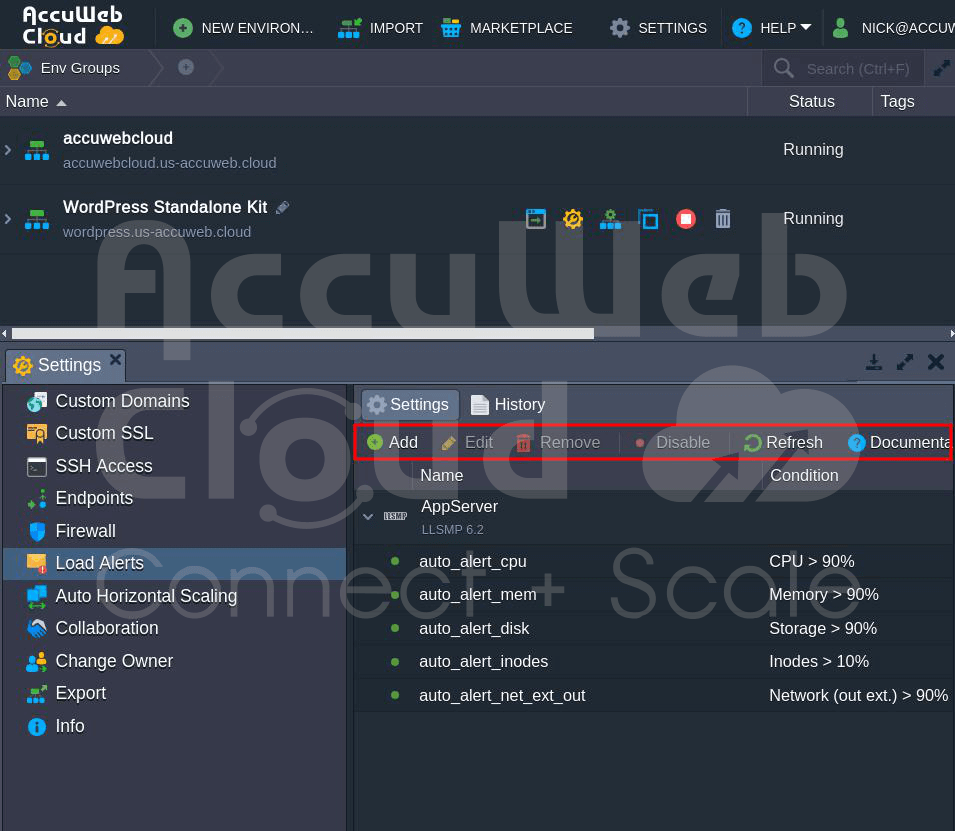
Step 3. Use the buttons in the tool panel to Add, Edit, Remove, Enable/Disable alerts, or Refresh the list.
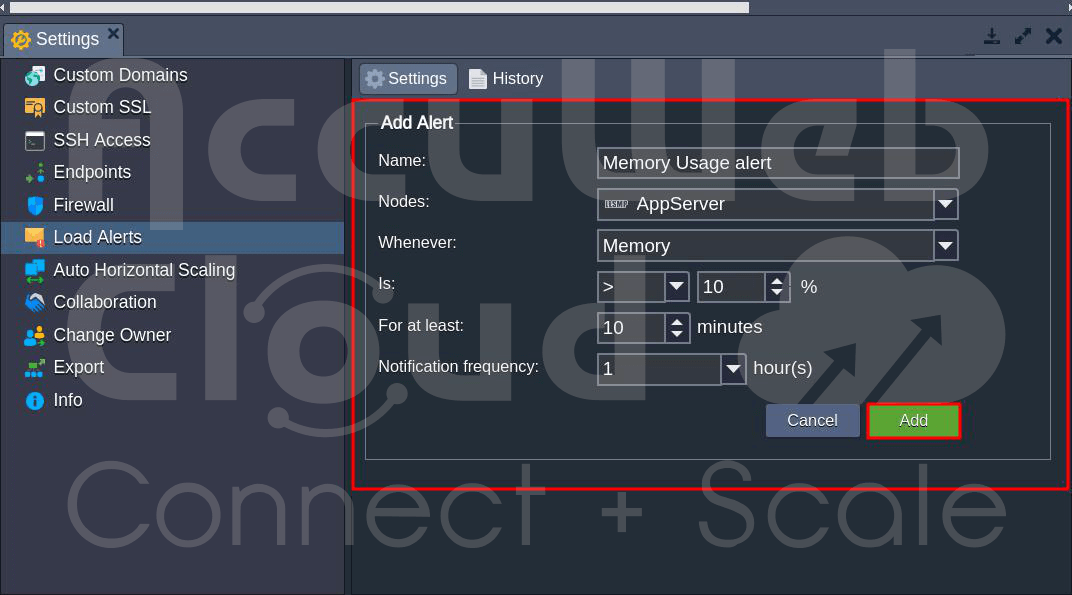
Step 4. To create your trigger, click “Add.” In the opened frame, define:
- Name: the trigger’s name
- Nodes: the type of environment’s node
- Whenever: the type of resources to be monitored
- Is: condition for trigger invocation (above or below a specified percentage or Mbps)
- For at least: a period before trigger execution
- Notification Frequency: delay for repetitive messages
After setting preferences, click “Add.”
Step 5. Once activated, the alert will appear in the list with the specified name.
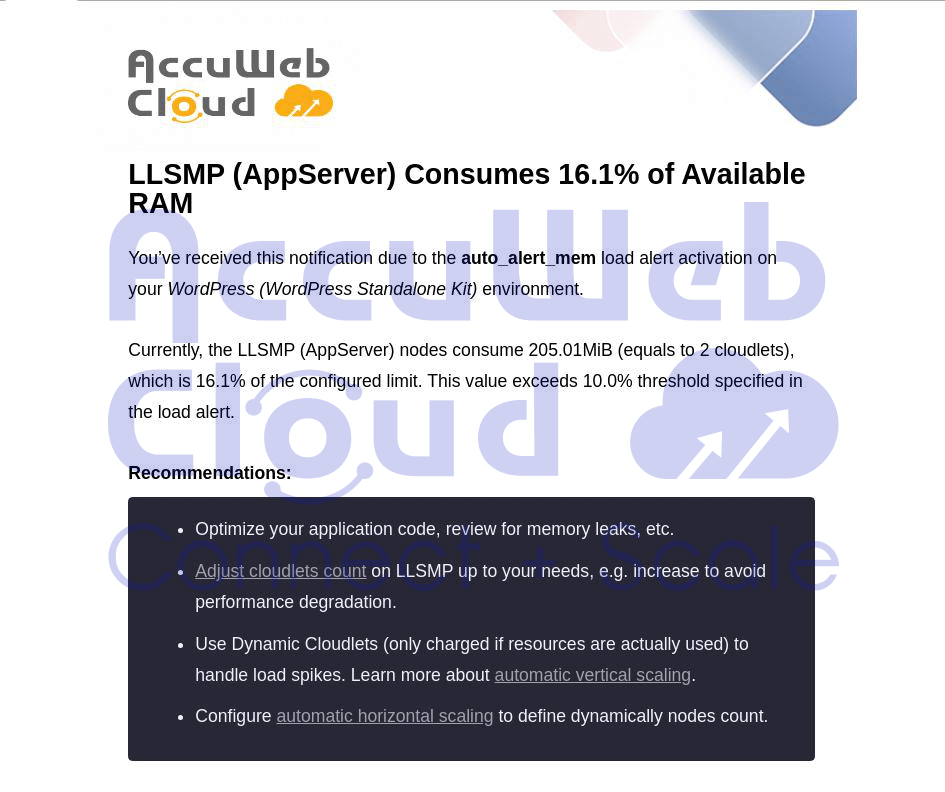
Step 6. Each time resource usage surpasses the specified condition during the set time, you’ll receive an email notification with consumption details and recommendations, along with a link for adjusting the node’s scaling limit.
How to check Triggers Execution History from Accuweb.Cloud dashboard?
To see a record of when triggers were activated for specific parts of a setup, follow these steps:
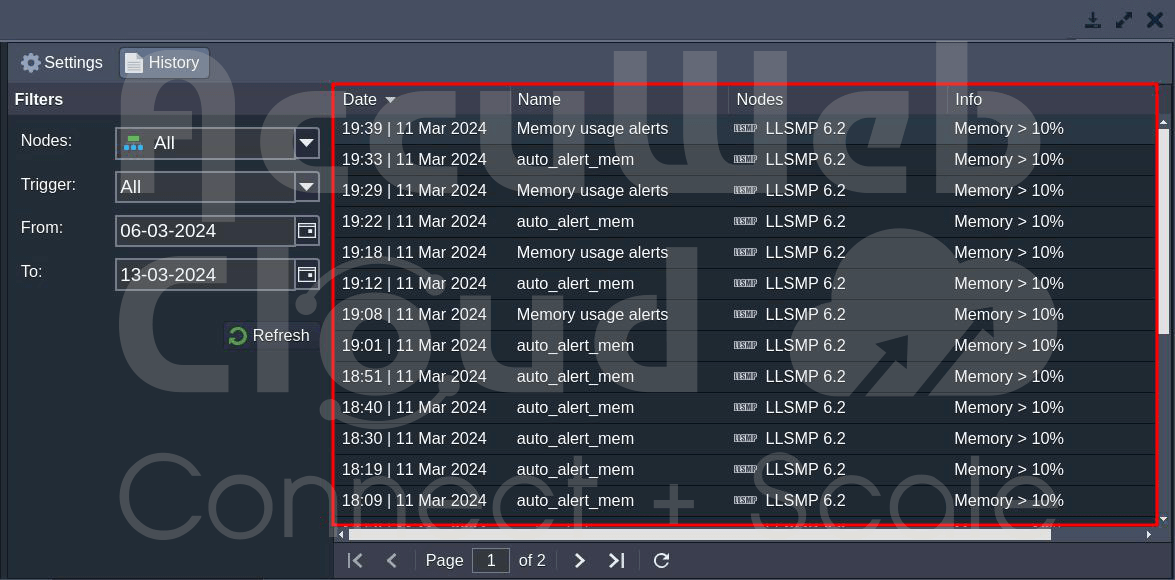
Step 1. Go to Load Alerts and click on the History tab. The system will automatically choose the Load Alerts notification Type.
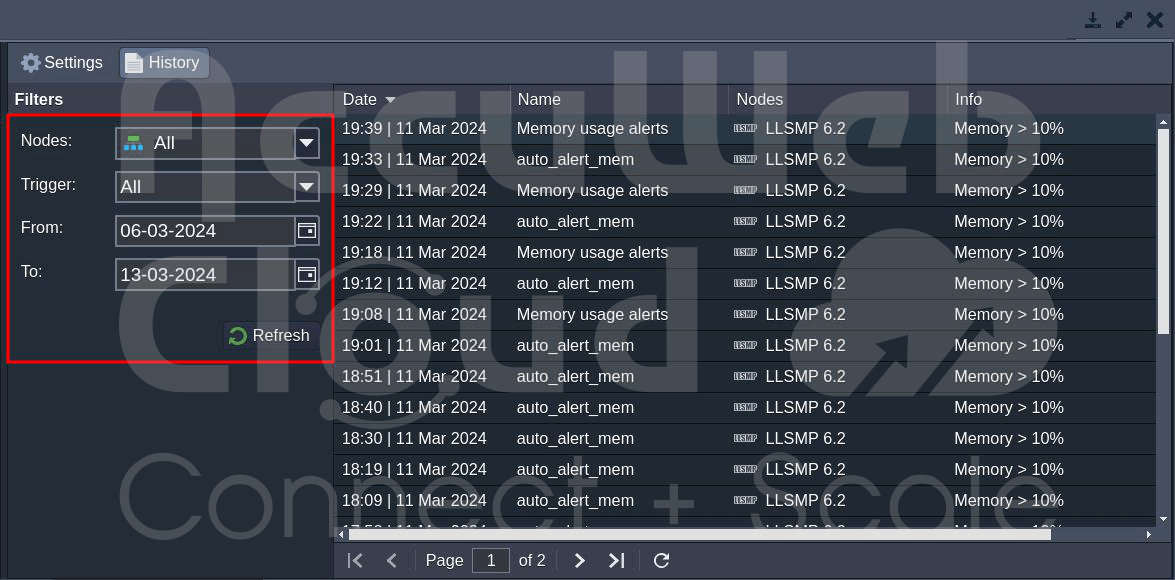
Step 2. From the Period drop-down list, choose a time range, such as day, week, month, or custom (where you can set specific dates).
Step 3. You’ll see a list of alerts that were activated during the chosen period, showing:
- Date and time when a trigger was activated
- Name of the alert
- Type of node the alert was set for
- A condition that triggered the alert
- Result of the alert (success or failure, indicating if a notification was sent)
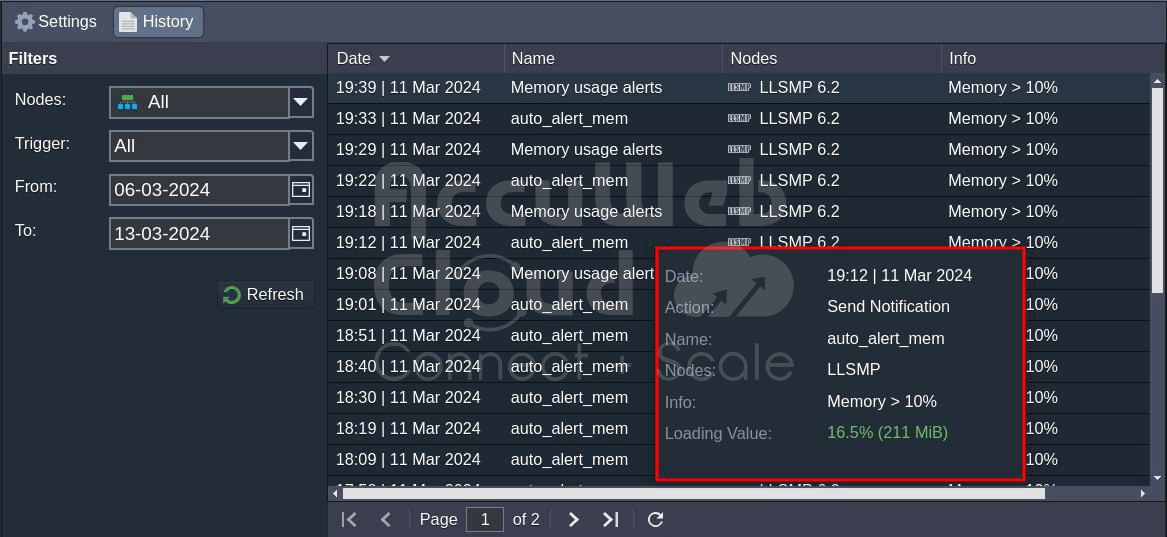
Step 4.: Click on a specific alert to view more details on the right, including:
Loading Value: the level of resource usage at the time of alert activation, with the number of consumed cloudlets in brackets
Action: the operation performed after the alert was triggered (e.g., sending a notification)
This way, you can set up alerts and be confident that the system will let you know about changes in your application’s load.
Conclusion
In conclusion, setting up load alerts from the dashboard involves navigating to Load Alerts -> History, selecting the Load Alerts notification Type, and specifying the period. This allows you to view a history of trigger executions, including details on activation time, alert name, node type, condition, and result. By following these steps, you can configure a range of alerts to ensure timely notifications about changes in your application’s load.

