
How to Monitor Usage and Quota Limits in AccuWeb.Cloud Platform?
Monitoring your resources usage on a regular basis gives you a better understanding of how your cloud environment is performing. It also helps you reduce unnecessary expenses and make sure resources are being used where they are needed most. Whether you’re tracking down a performance issue, planning a capacity upgrade, or just making sure things are running smoothly, AccuWeb.Cloud gives you real-time and historical usage data right inside your dashboard no third-party tools needed.
Here’s how to find it.
Step 1: Log In to Your AccuWeb.Cloud Dashboard
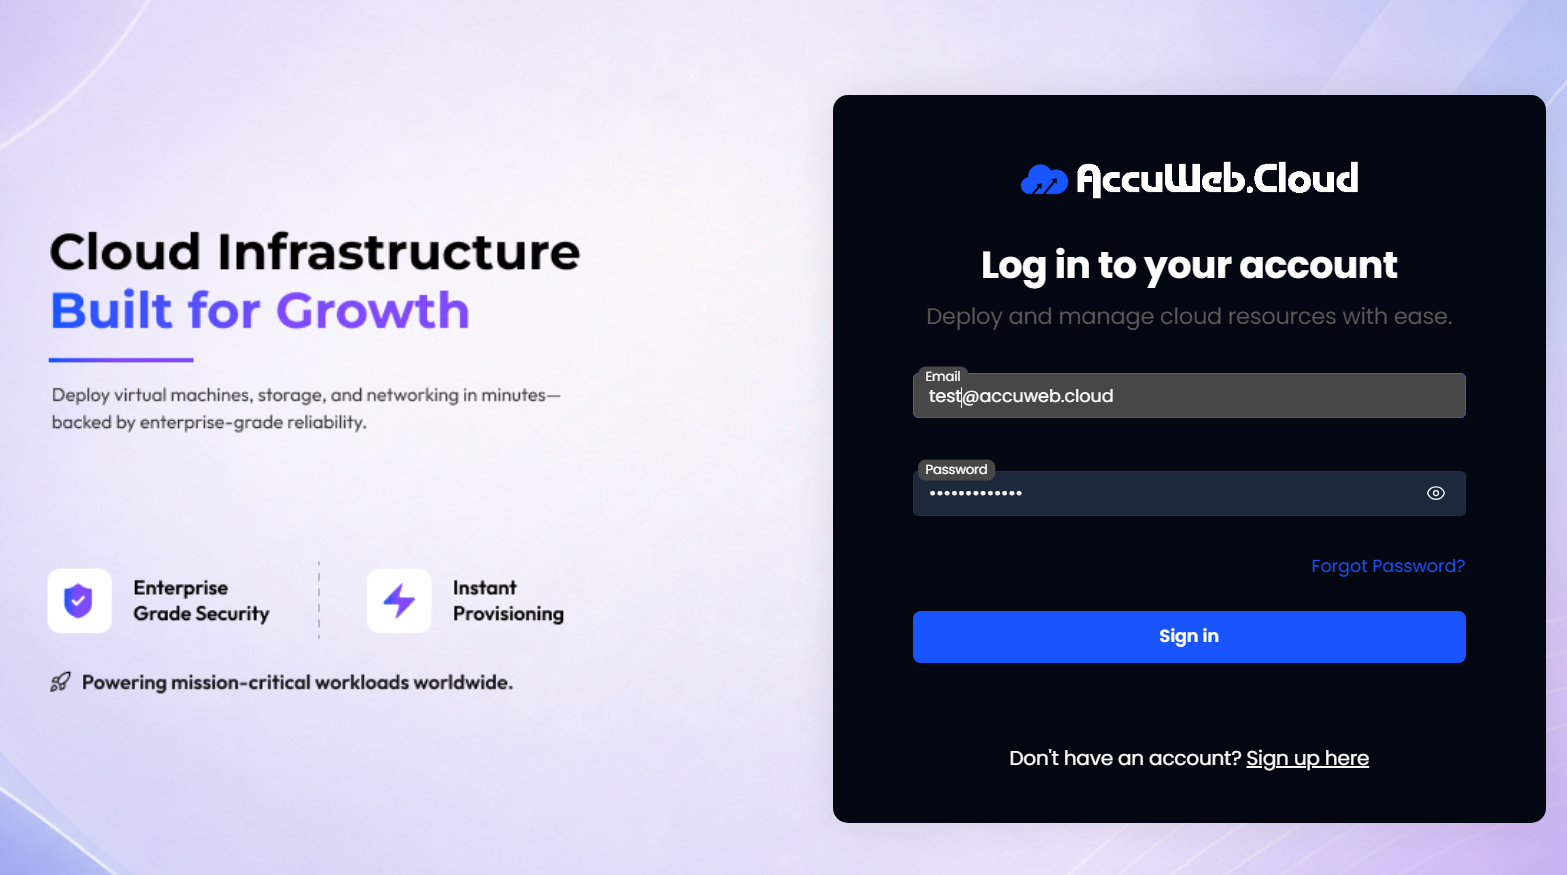
Go to manage.accuweb.cloud and sign in with your credentials to access your cloud dashboard.
Step 2: Navigate to Instances
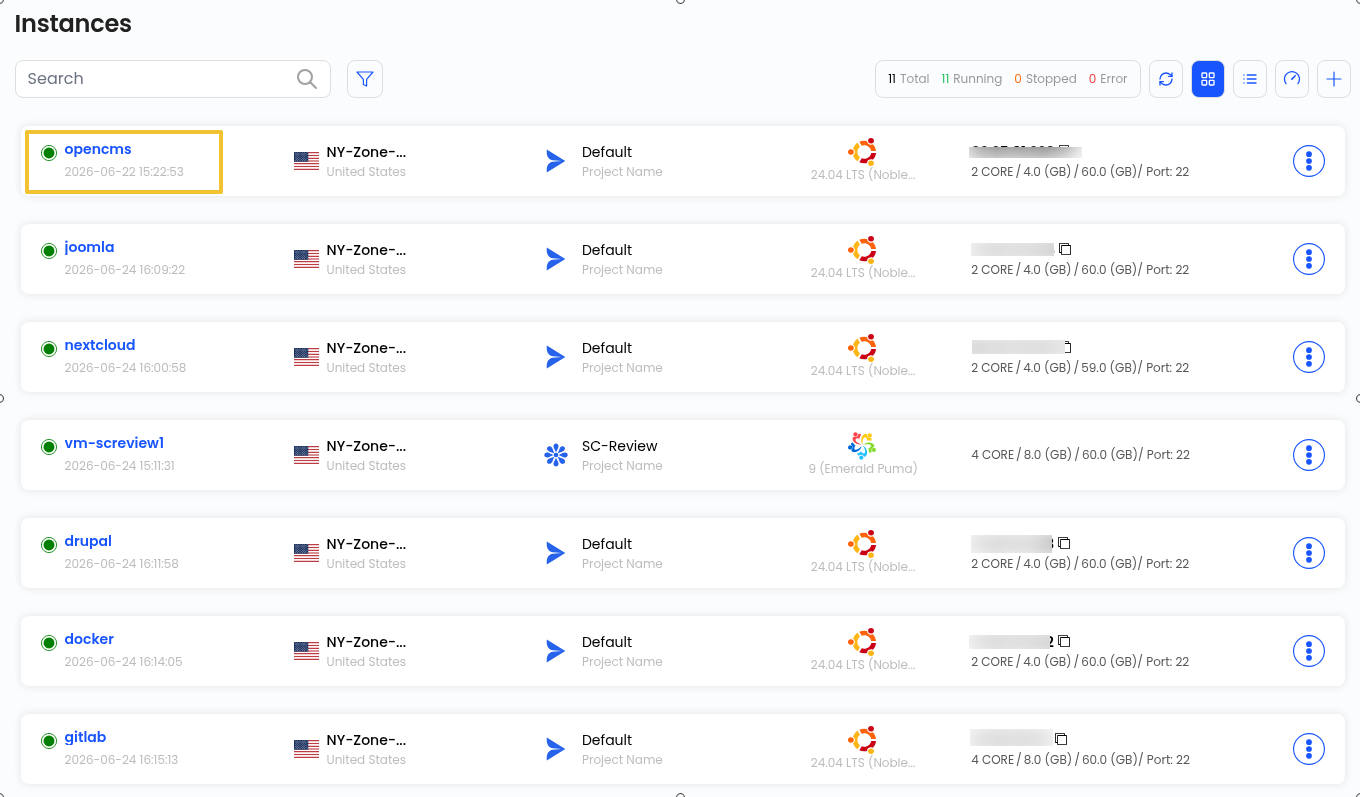
Once you’re in, look at the left-side menu and click on “Instances”. This will bring up a list of all the virtual machines running under your account.

Step 3: Select the Instance You Want to Monitor
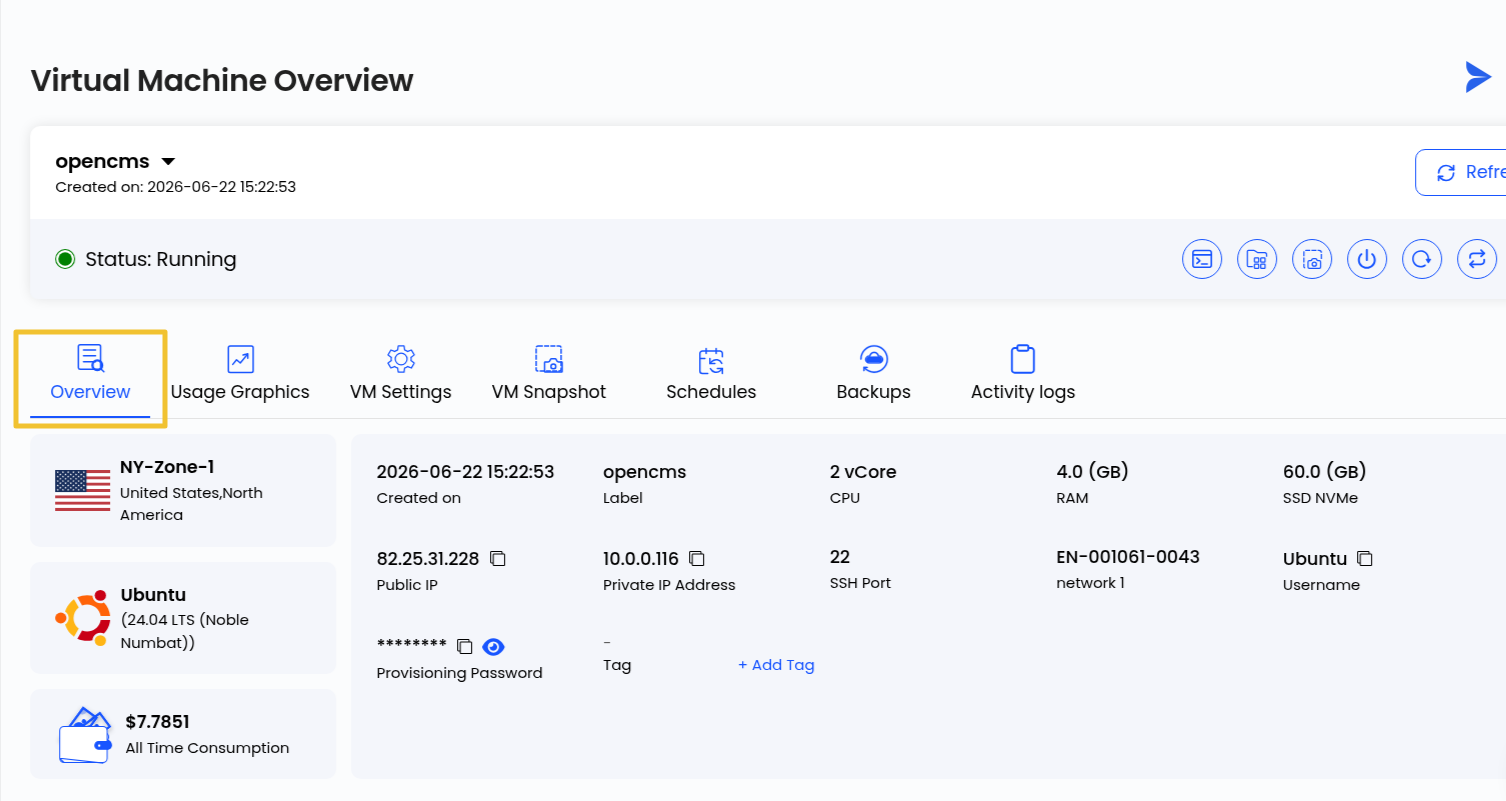
From the instances list, click on the name of the instance whose usage you’d like to check. This will take you to that instance’s dedicated overview page.
Step 4: Check Real-Time Resource Usage
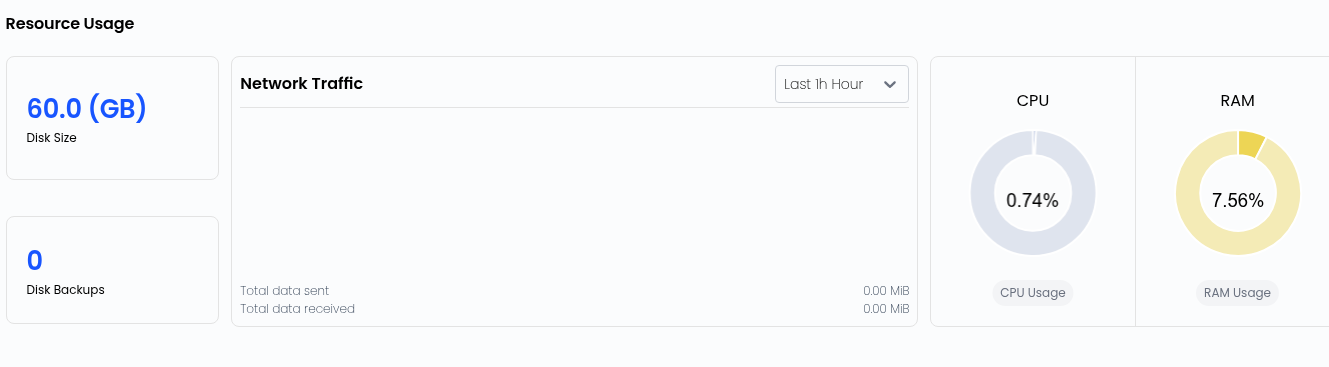
On the instance overview page, scroll down to the bottom , you’ll find the Resource Usage section. This gives you a live snapshot of how your instance is performing right now, including:
- RAM usage
- CPU usage
- Network usage
This is your go-to spot for a quick health check on any running instance.
Step 5: Open Usage Graphics for Historical Data
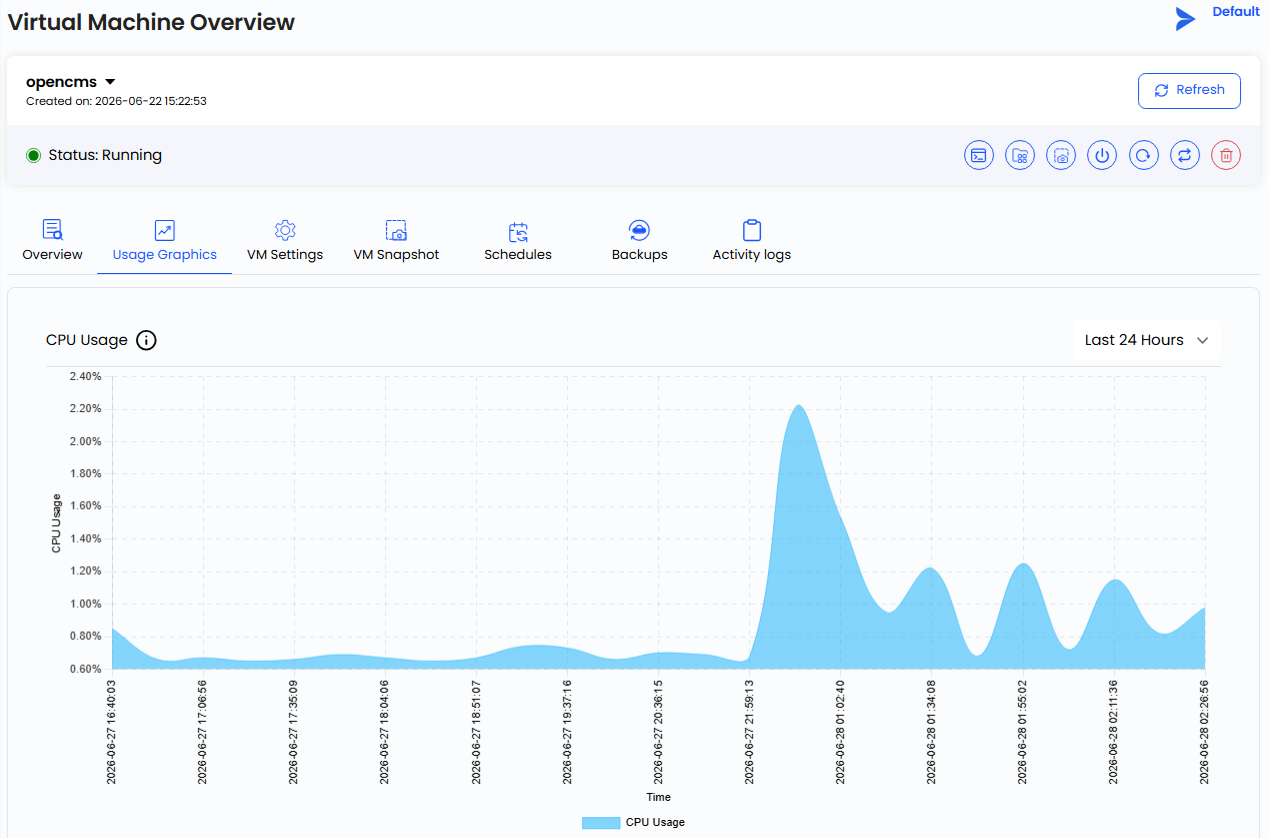
If you need to look at usage over a specific time period, click on “Usage Graphics”. This opens up a more detailed view where you can analyse trends and spot patterns over time , not just what’s happening at this exact moment.

Step 6: Analyse Your Usage Graphs
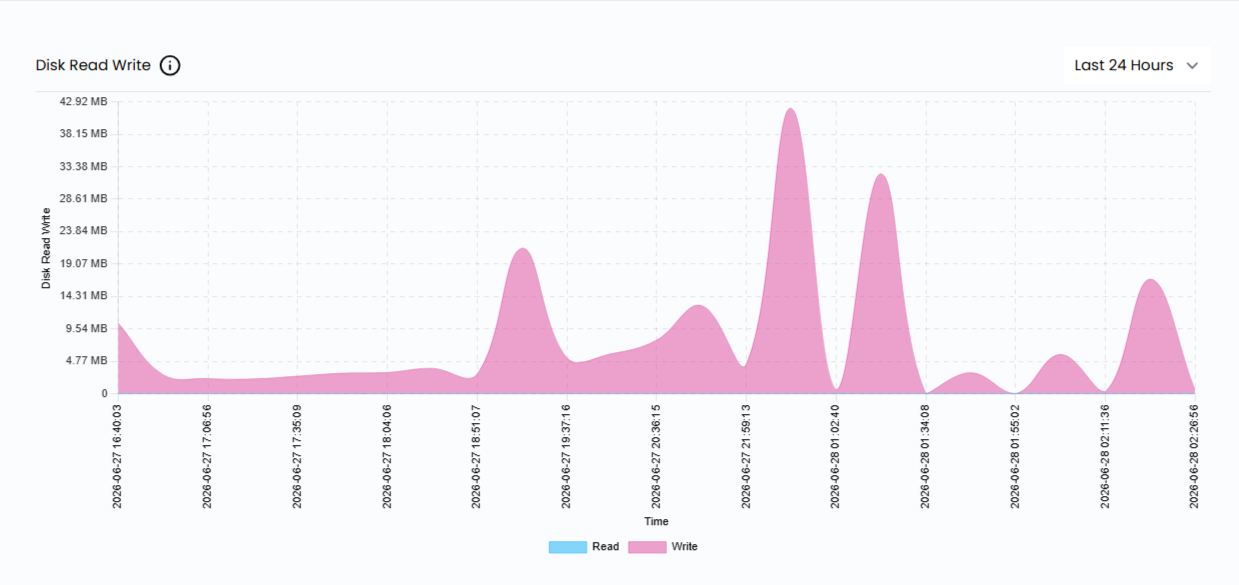
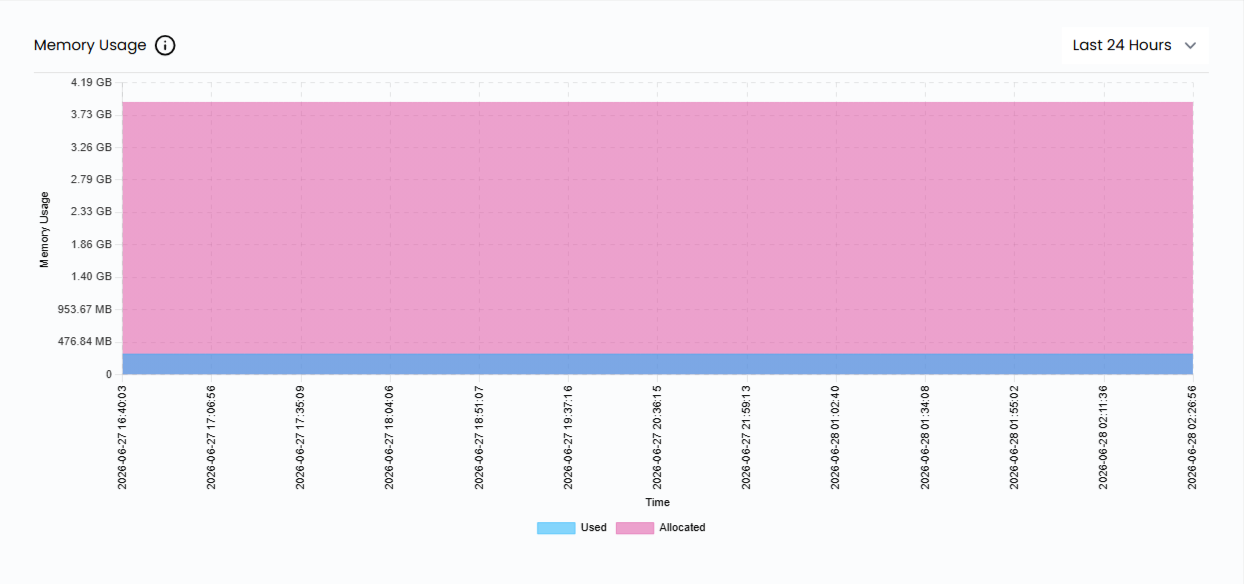
Inside Usage Graphics, you’ll get a full breakdown of your instance’s performance history. The graphs cover:
- CPU usage
- Disk Read/Write
- Memory usage
- Network traffic

- Disk IO Read/Write
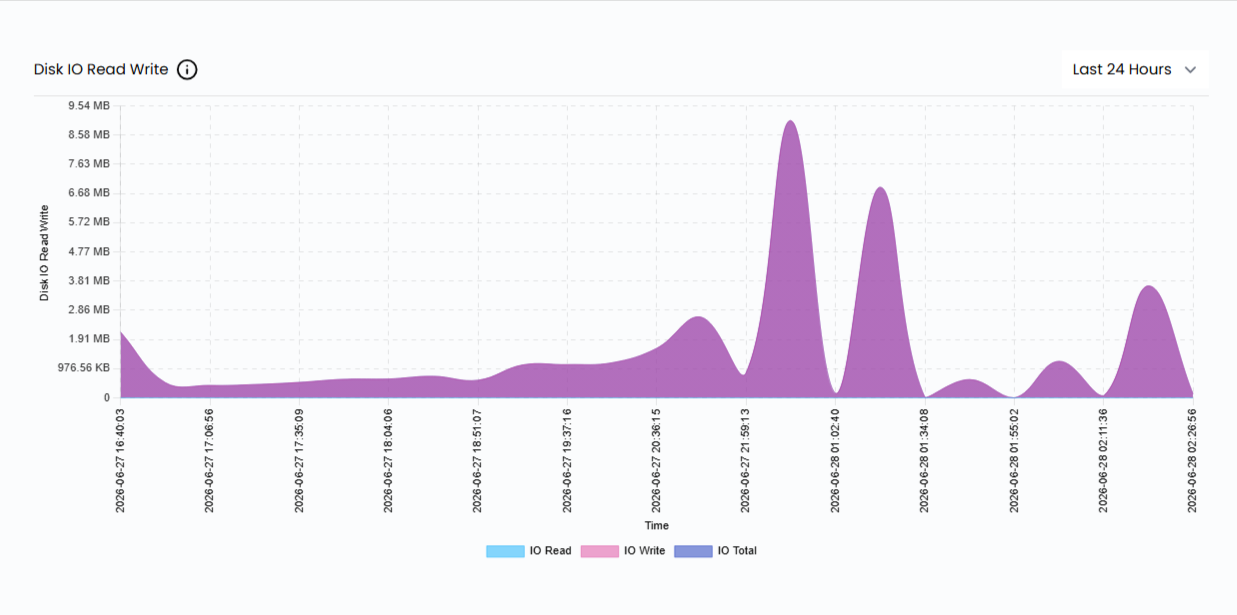
Each graph comes with date and time so you can zero in on a specific duration , whether that’s the last hour or the last day. This makes it easy to correlate spikes with specific events, deployments, or traffic surges.
Conclusion
Monitoring your instance usage doesn’t have to be complicated. AccuWeb.Cloud puts all the data you need , real-time stats and historical graphs , in one place, just a few clicks away. Making it a habit to regularly check your resource usage helps you catch issues early, right-size your instances, and avoid unexpected performance bottlenecks before they become a problem.