
How to Check Daily Usage of Your Cloud Services from Your Dashboard
If you’re running virtual machines, volumes, backups, or IP addresses on an hourly billing plan, it’s easy to lose track of what’s actually costing you money day to day. Maybe an instance got left running longer than it should have, or a backup job is eating more hours than you expected. Either way, waiting for the monthly invoice to find out isn’t ideal.
AccuWeb.Cloud has a Daily Estimated Usage report built right into the dashboard for this reason. It breaks down exactly what you’re being charged for, service by service, day by day. Here’s how to find it and actually make sense of what it’s showing you.
Step 1: Log In
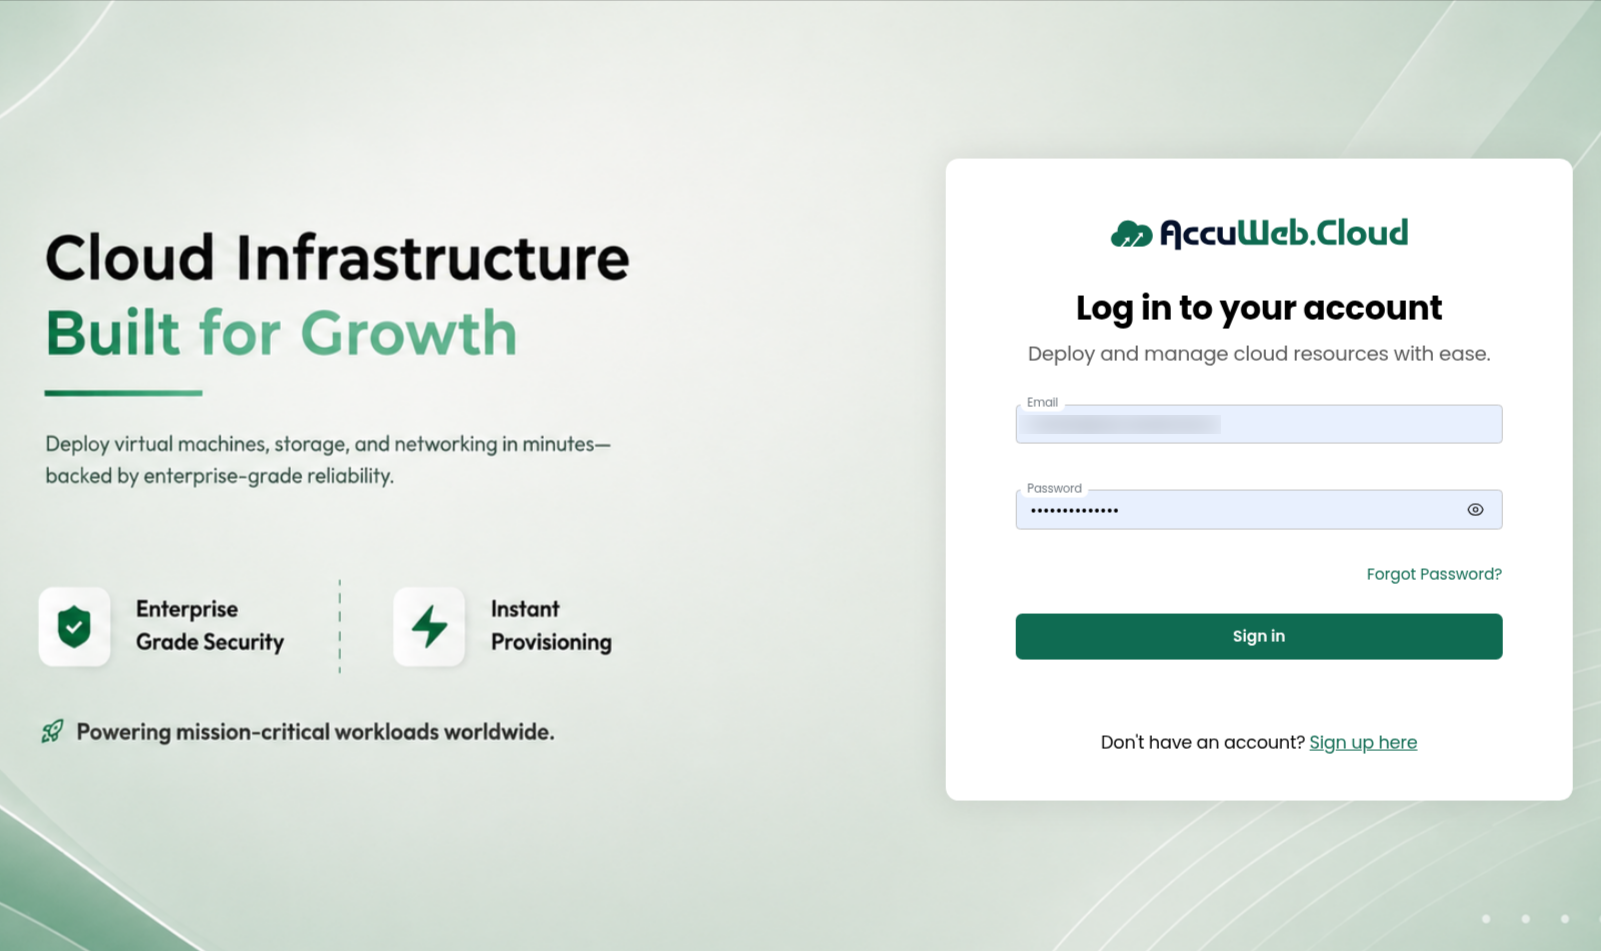
Head to manage.accuweb.cloud/login and sign in with your registered email and password, same as always.
Step 2: Head to Billing
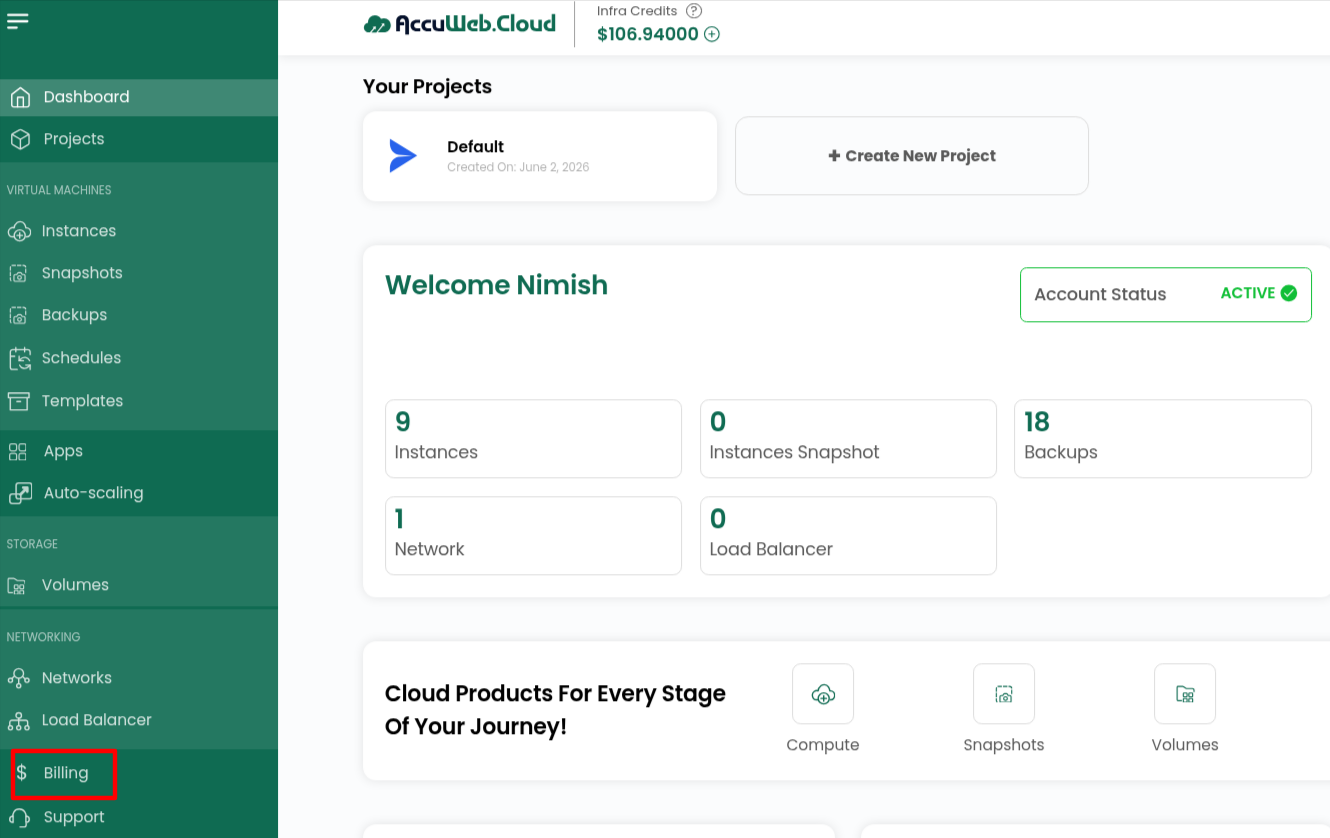
Once you’re in, look at the left sidebar. There’s a Billing tab in there, usually somewhere in the middle of the menu. Click it and you’ll land on your billing overview, subscriptions, credits, transactions, all that.
Step 3: Click Daily Estimated Usage
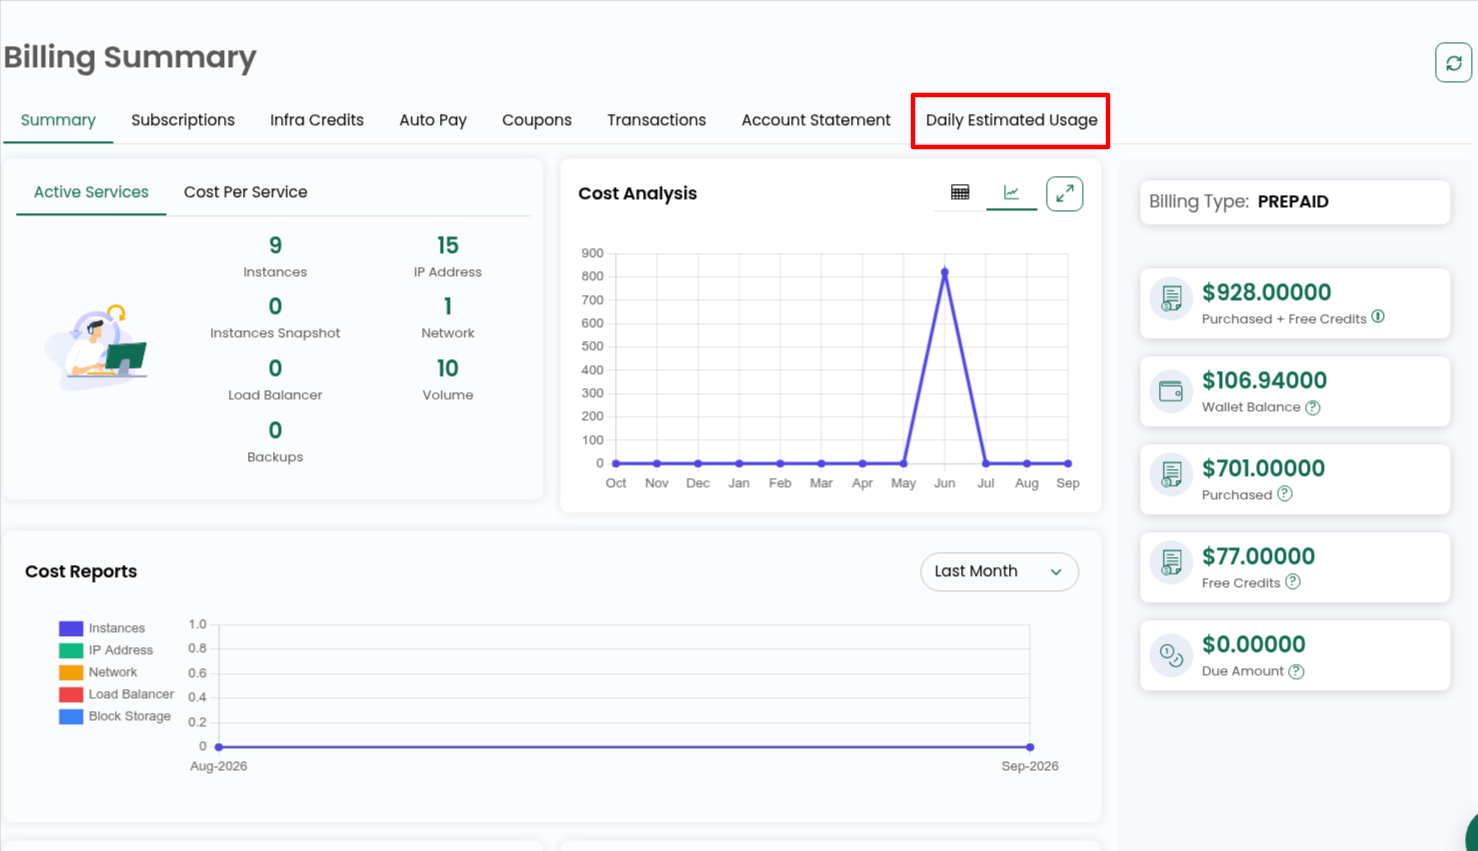
Across the top of the Billing page you’ll see a row of tabs, Summary, Subscriptions, Infra Credits, Auto Pay, Coupons, Transactions, Account Statement. The one you want is Daily Estimated Usage, click on that.
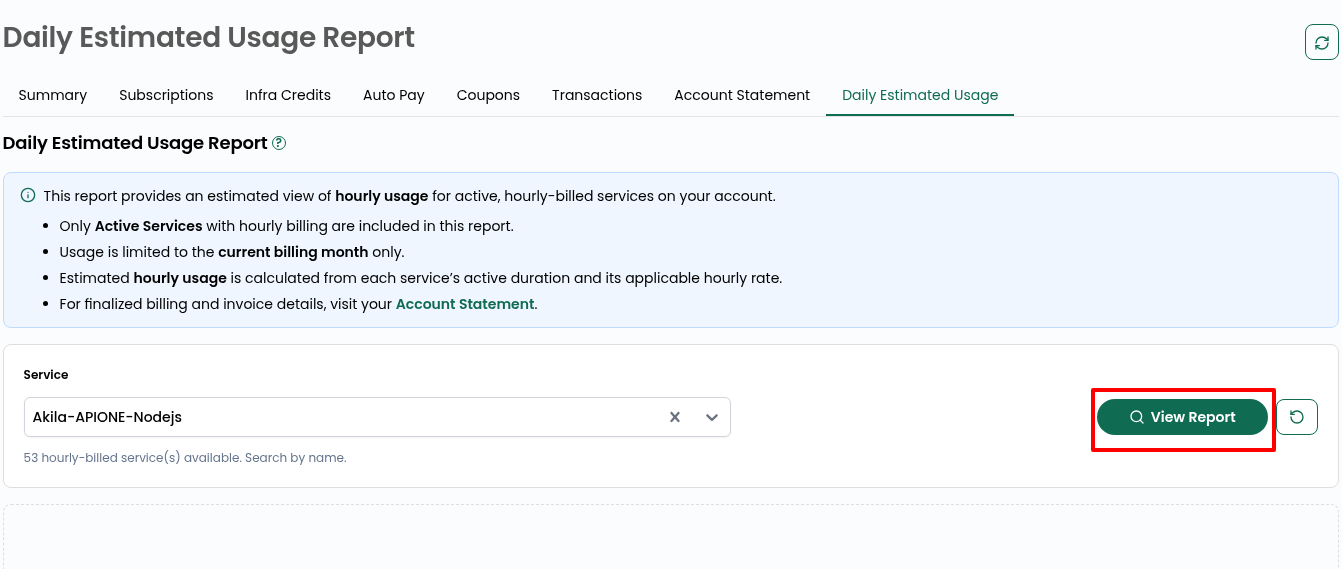
Step 4: Pick a Service
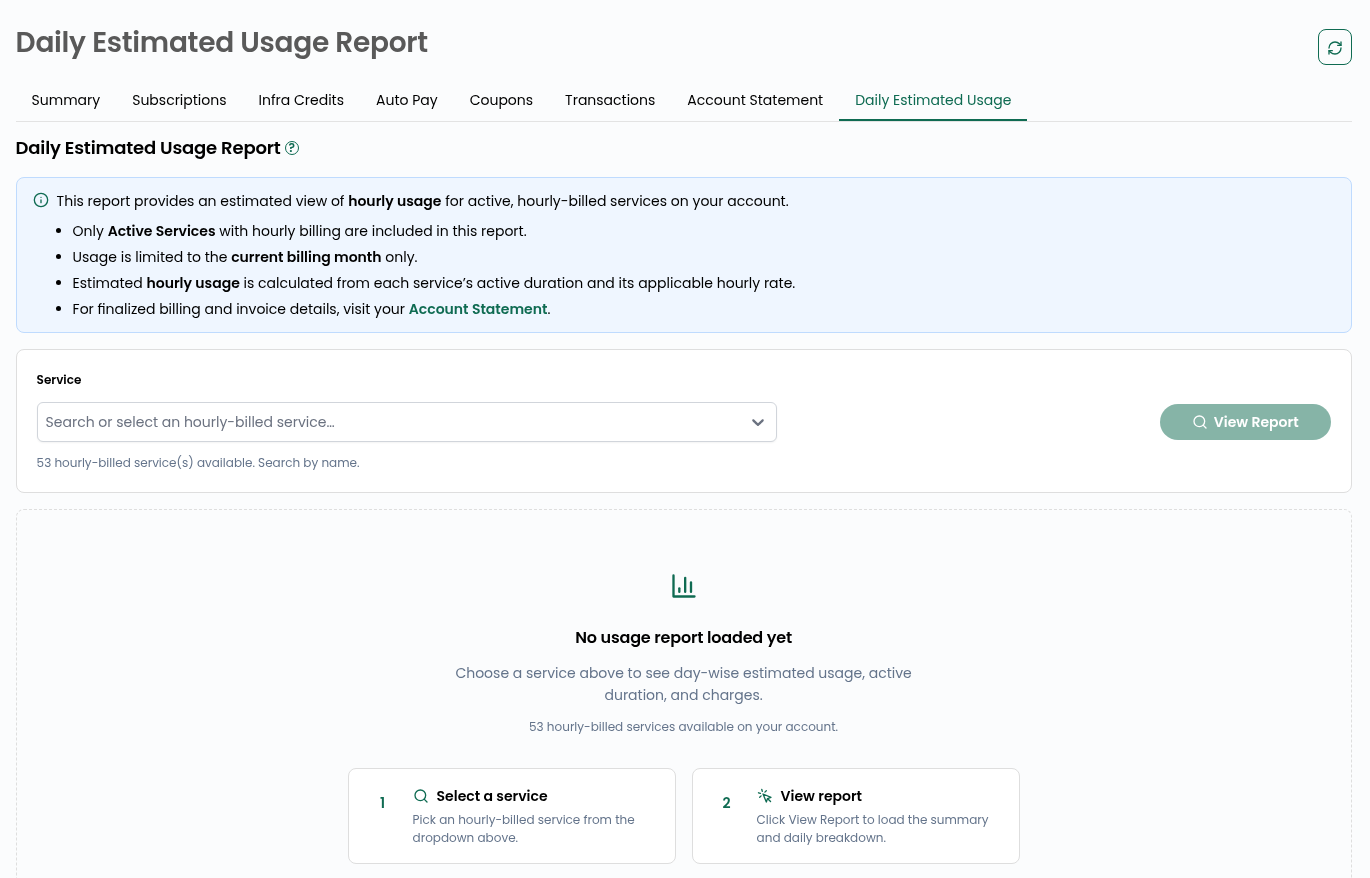
There’s a dropdown here where you search for the specific service you want to look at, a VM, an IP, a volume, whatever’s relevant. If you’ve got dozens of services running, just type a few letters and it’ll filter down for you.
Step 5: Hit View Report
Select your service, then click View Report. It’ll pull the usage data for that service for the current billing month.
Step 6: Read the Breakdown
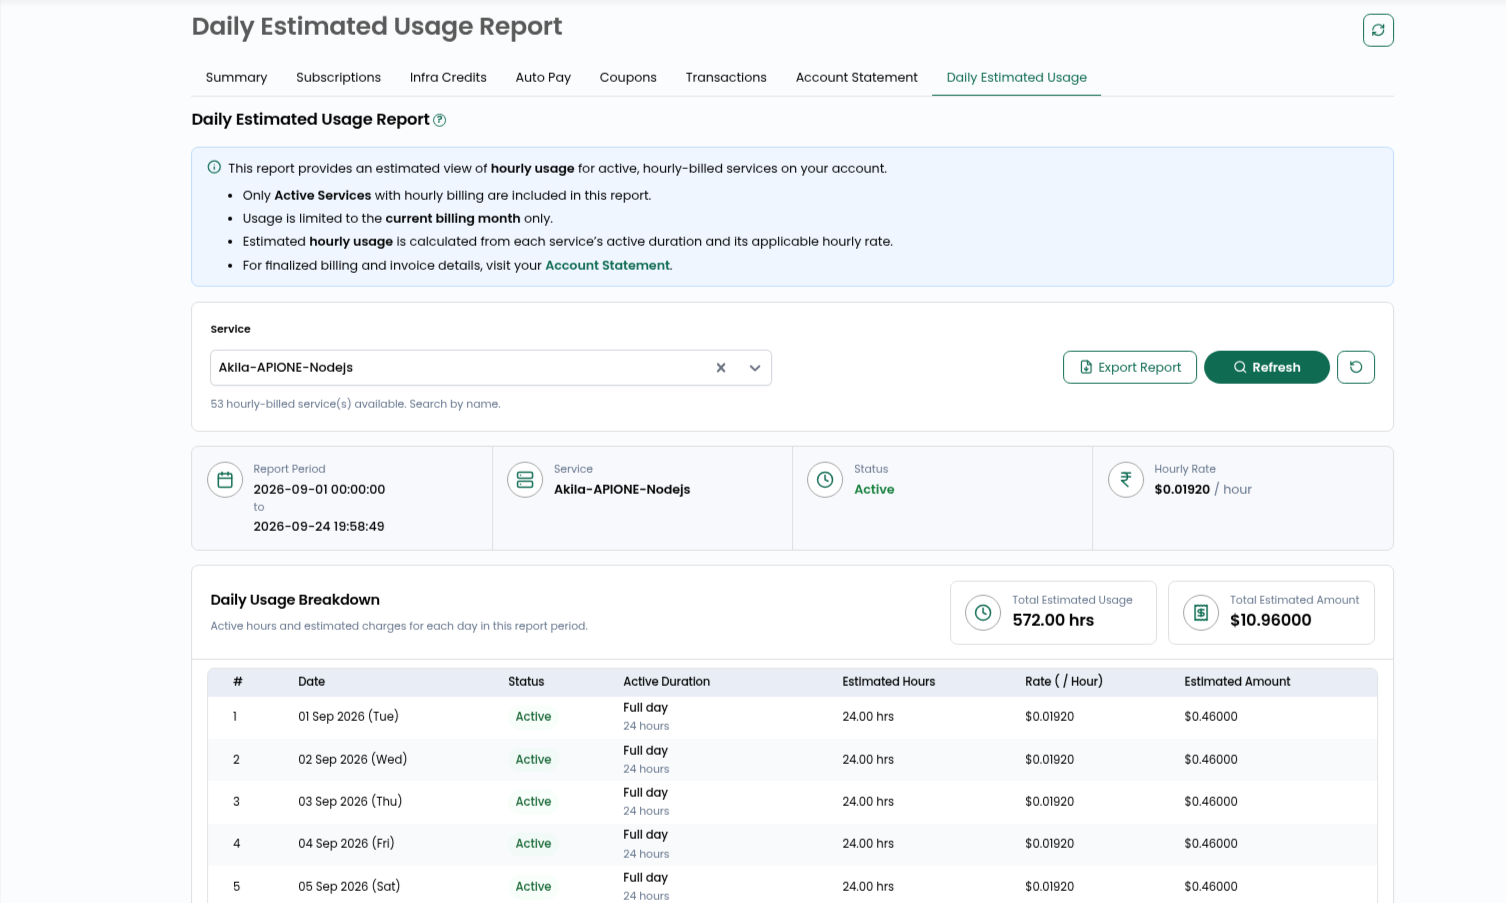
Now you’re looking at a table with a row for every day. Here’s what each column actually tells you:
- Date– which day this row is for
- Status– whether the service was active that day or not
- Active Duration– how many hours it actually ran
- Estimated Hours– basically the same number as above, just labeled for the billing calculation
- Rate– the hourly rate you’re being charged for that service
- Estimated Amount– what that day cost you, active hours times the rate
At the top of the report you’ll also see totals for the billing period so far, total hours and total estimated cost, plus an export button if you want to pull the data out and keep it somewhere.
Conclusion
Even though everything’s billed hourly behind the scenes, this report lays it out day by day so it’s actually readable. It’s worth checking every so often, especially if you’re running a lot of services, just to make sure nothing’s quietly running longer than it should be. And if you ever need the finalized numbers for accounting purposes rather than estimates, that’s what the Account Statement tab is for.